5 Great Linux Disk IO monitoring tools


5 Great Linux Disk IO monitoring tools
Below you see my favorite best 5 Linux Disk IO Monitoring Tools.
IOTOP
iotop Linux is a simple top-like disk I/O monitor tool.
iotop command watches I/O usage information output by the Linux kernel and displays a table of current I/O usage by processes or threads on the system. It also displays the percentage of time the thread/process spent while swapping in and while waiting on I/O.
In addition, the total I/O bandwidth read and written during the sampling period is displayed at the top of the interface.
iotop CentOS install
To install iotop on CentOS / RedHat Linux:
# yum install iotop
iotop Ubuntu install
To install iotop on Ubuntu or Debian:
$ sudo apt-get install iotop
iotop usage
Use the left and right arrows to change the sorting
r – to reverse the sorting order
o – to toggle the –only option
q – to quit
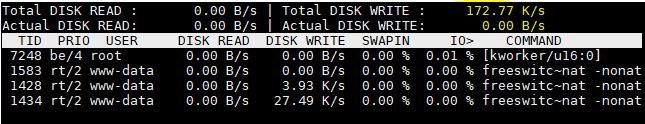
iotop example output:
iostat
The iostat command is used for monitoring system input/output device loading by observing the time the devices are active in relation to their average transfer rates. The iostat Linux command generates reports that can be used to change system configuration to better balance the input/output load between physical disks.
The iostat command generates two types of reports, the CPU Utilization report and the Device Utilization report. iostat device report provides statistics on a per physical device or partition basis. Block devices and partitions for which statistics are to be displayed may be entered on the command line.
- Device:
This column gives the device (or partition) name as listed in the /dev directory. - tps
Indicate the number of transfers per second that were issued to the device. A transfer is an I/O request to the device. Multiple logical requests can be combined into
a single I/O request to the device. A transfer is of indeterminate size.
Iostat Linux Installation
iostat is part of sysstat package, so for using iostat Linux command we need install sysstat package.
iostat Ubuntu/Debian install
$ sudo apt-get install sysstat -y
iostat CentOS/RedHat install
# yum install sysstat -y
iostat examples
Display a single history since boot report for all CPU and Devices.
# iostat
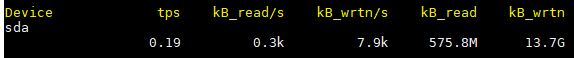
Display a continuous device report at two second intervals. -h Make the Device Utilization Report easier to read by a human.
# iostat -d 2 -h
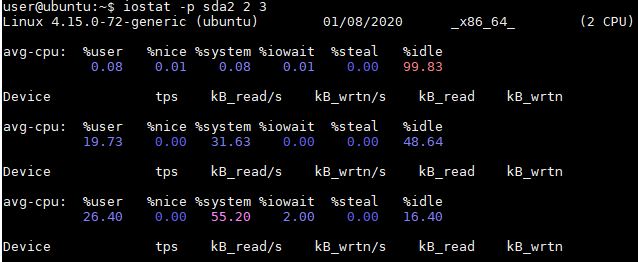
Display three reports at two second intervals for device sda and all its partitions
# iostat -p sda 2 3
ATOP
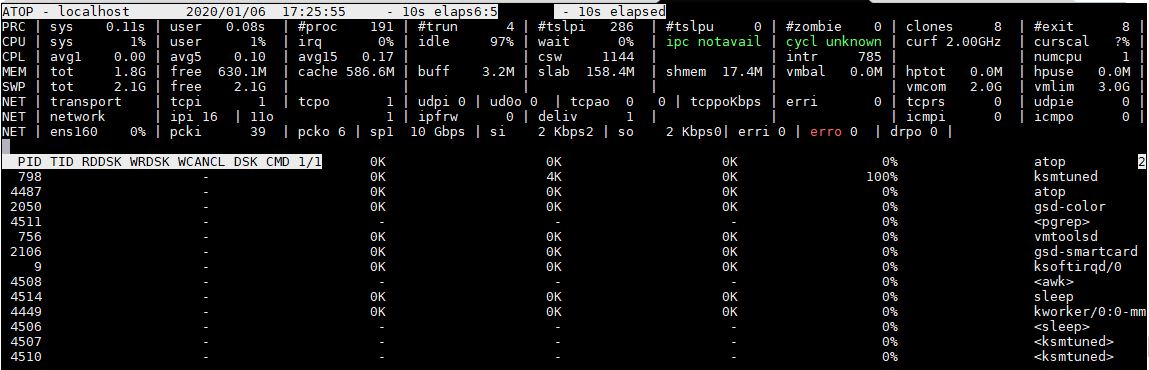
The program atop is an interactive monitor to view the load on a Linux system. It shows the occupation of the most critical hardware resources (from a performance point of view) on system level, i.e. CPU, memory, disk and network. atop man pages.
CentOS Install atop
Before install atop on CentOS make sure you have already installed EPEL repository in your CentOS or RedHat. How To Install EPEL Repo on a CentOS and RHEL 7.x.
# yum install atop
Ubuntu install atop
$ sudo apt-get install atop
atop example output:
Dstat
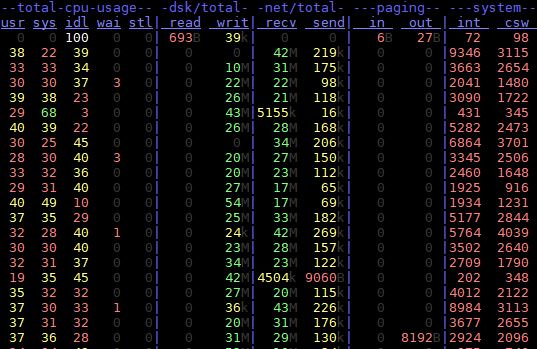
Dstat command allows view all of your system resources instantly, you can eg. compare disk usage in combination with interrupts from your IDE controller, or compare the network bandwidth numbers directly with the disk throughput.
Dstat is unique in letting you aggregate block device throughput for a certain diskset or network bandwidth for a group of interfaces, ie. you can see the throughput for all the block devices that make up a single filesystem or storage system. It’s Linux monitor disk IO by process
Dstat also allows its data to be directly written to a CSV file.
dstat CentOS Install
# yum install dstat
dstat Ubuntu Install
$ sudo apt-get install dstat
Dstat examples
# dstat
example output:
What process is consuming the most I/O bandwidth
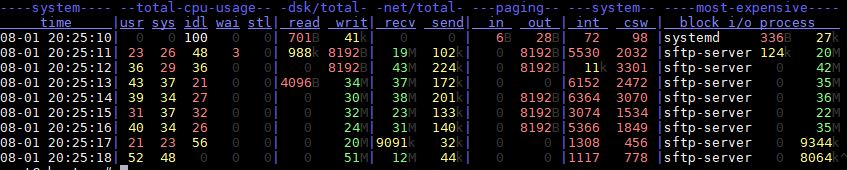
# dstat -ta --top-bio
Linux monitor disk IO by process example output:
SAR
The sar command writes to standard output the contents of selected cumulative activity counters in the operating system. The accounting system, based on the values in the count and interval parameters, writes information the specified number of times spaced at the specified intervals in seconds. If the interval parameter is set to zero, the sar command displays the average statistics for the time since the system was started. If the interval parameter is specified without the count parameter, then reports are generated continuously.
SAR usage example
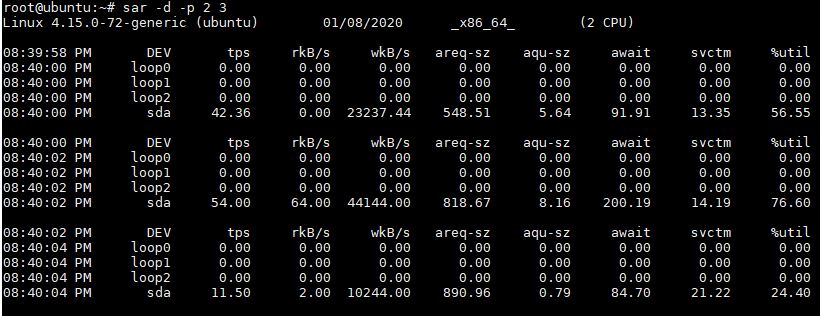
Generate Disk I/O report using SAR:
# sar -d -p 2 3