
Linux Best Open Source terminal tools (terminal commands)
Below you can see greatest open source terminal apps list: htop, dstat, iftop, iotop, iptraf, mc – Midnight Commander, mtr, nmap, sox, wget. Terminal commands.
htop – interactive process viewer
Htop is a free (GPL) ncurses-based process viewer for Linux.
It is similar to top, but allows you to scroll vertically and horizontally, so you can see all the processes running on the system, along with their full command lines.
Tasks related to processes (killing, renicing) can be done without entering their PIDs.
How to install htop on CentOS 7

Installing htop on CentOS 6 –>
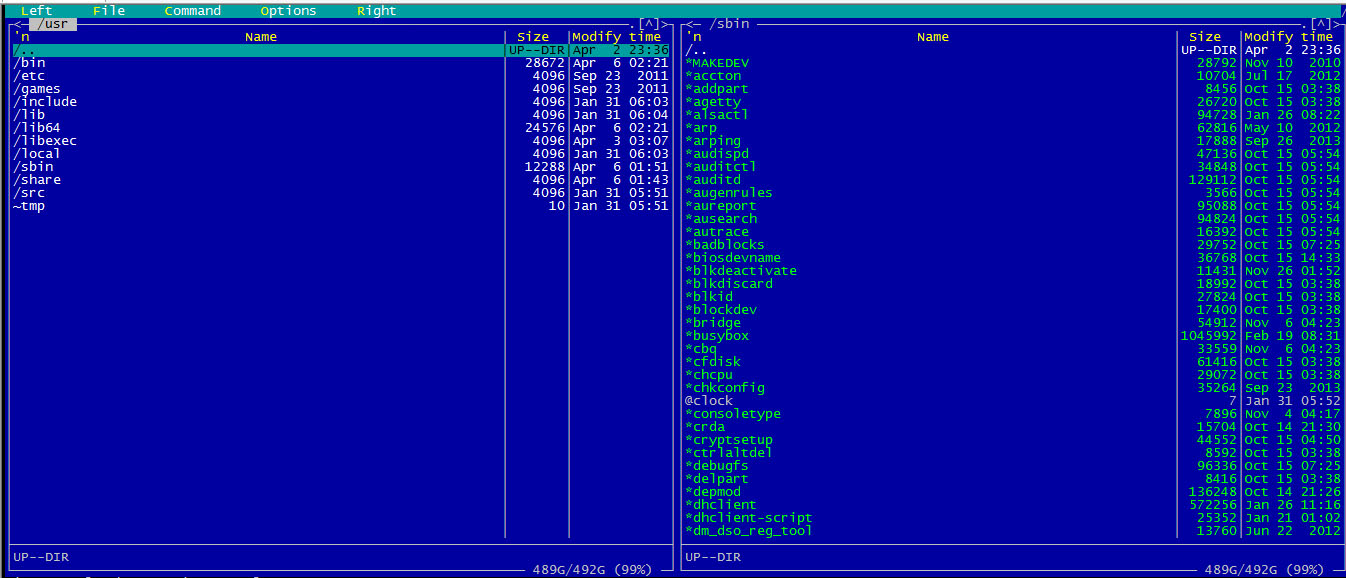
mc – Visual shell for Unix-like systems.
GNU Midnight Commander is a directory browser/file manager for Unix-like operating systems.
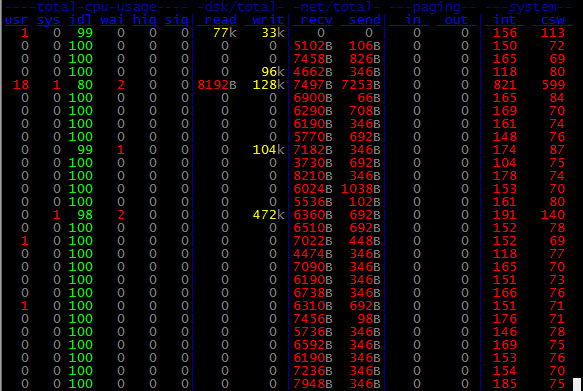
dstat – versatile tool for generating system resource statistics
Dstat is a versatile replacement for vmstat, iostat and ifstat. Dstat overcomes some of the limitations and adds some extra features.
Dstat allows you to view all of your system resources instantly, you can eg. compare disk usage in combination with interrupts from your IDE controller, or compare the network bandwidth numbers directly with the disk throughput (in the same interval).
Dstat also cleverly gives you the most detailed information in columns and clearly indicates in what magnitude and unit the output is displayed.
Less confusion, less mistakes, more efficient.
Dstat is unique in letting you aggregate block device throughput for a certain diskset or network bandwidth for a group of interfaces, ie. you can see the throughput for all the block devices that make up a single filesystem or storage system.
Dstat allows its data to be directly written to a CSV file to be imported and used by OpenOffice, Gnumeric or Excel to create graphs.
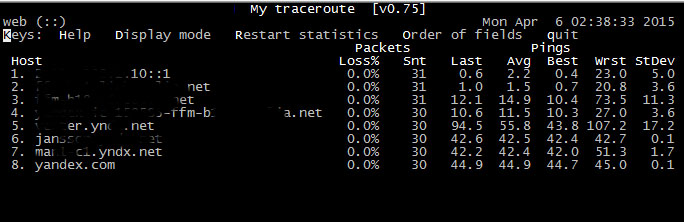
mtr – a network diagnostic tool
mtr combines the functionality of the traceroute and ping programs in a single network diagnostic tool.
As mtr starts, it investigates the network connection between the host mtr runs on and HOSTNAME. by sending packets with purposly low TTLs. It continues to send packets with low TTL, noting the response time of the intervening routers.
This allows mtr to print the response percentage and response times of the internet route to HOSTNAME. A sudden increase in packetloss or response time is often an indication of a bad (or simply overloaded) link.
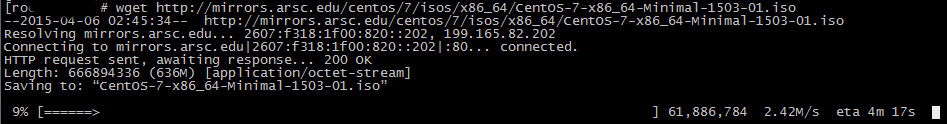
Wget – The non-interactive network downloader.
GNU Wget is a free utility for non-interactive download of files from the Web. It supports HTTP, HTTPS, and FTP protocols, as well as retrieval through HTTP proxies.
Wget is non-interactive, meaning that it can work in the background, while the user is not logged on. This allows you to start a retrieval and disconnect from the system, letting Wget finish the work.
By contrast, most of the Web browsers require constant user’s presence, which can be a great hindrance when transferring a lot of data.
Wget can follow links in HTML, XHTML, and CSS pages, to create local versions of remote web sites, fully recreating the directory structure of the original site.
This is sometimes referred to as “recursive downloading.” While doing that, Wget respects the Robot Exclusion Standard ()/robots.txt). Wget can be instructed to convert the links in downloaded files to point at the local files, for offline viewing.
Wget has been designed for robustness over slow or unstable network connections; if a download fails due to a network problem, it will keep retrying until the whole file has been retrieved.
If the server supports regetting, it will instruct the server to continue the download from where it left off.
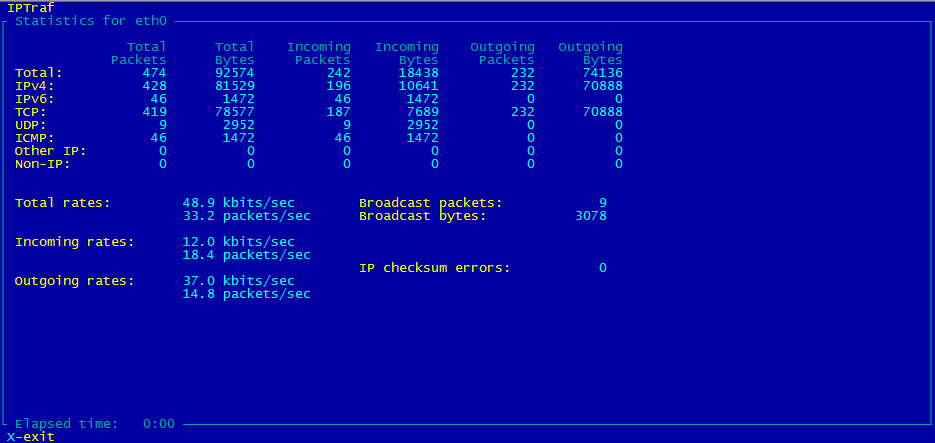
iptraf – Interactive Colorful IP LAN Monitor
iptraf is an ncurses-based IP LAN monitor that generates various network statistics including TCP info, UDP counts, ICMP and OSPF information, Ethernet load info, node stats, IP checksum errors, and others.
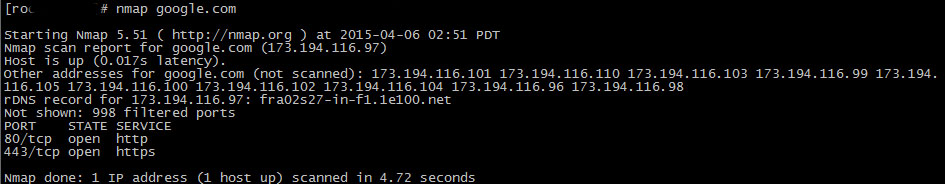
nmap – Network exploration tool and security / port scanner
Nmap (“Network Mapper”) is an open source tool for network exploration and security auditing. It was designed to rapidly scan large networks, although it works fine against single hosts.
Nmap uses raw IP packets in novel ways to determine what hosts are available on the network, what services (application name and version) those hosts are offering, what operating systems (and OS versions) they are running, what type of packet filters/firewalls are in use, and dozens of other characteristics.
While Nmap is commonly used for security audits, many systems and network administrators find it useful for routine tasks such as network inventory, managing service upgrade schedules, and monitoring host or service uptime.
The output from Nmap is a list of scanned targets, with supplemental information on each depending on the options used. Key among that information is the “interesting ports table”.. That table lists the port number and protocol, service name, and state.
The state is either open, filtered, closed, or unfiltered. Open. means that an application on the target machine is listening for connections/packets on that port.
Filtered. means that a firewall, filter, or other network obstacle is blocking the port so that Nmap cannot tell whether it is open or closed. Closed. ports have no application listening on them, though they could open up at any time. Ports are classified as unfiltered.
when they are responsive to Nmap´s probes, but Nmap cannot determine whether they are open or closed. Nmap reports the state combinations open|filtered.
and closed|filtered. when it cannot determine which of the two states describe a port. The port table may also include software version details when version detection has been requested.
When an IP protocol scan is requested (-sO), Nmap provides information on supported IP protocols rather than listening ports.
In addition to the interesting ports table, Nmap can provide further information on targets, including reverse DNS names, operating system guesses, device types, and MAC addresses.
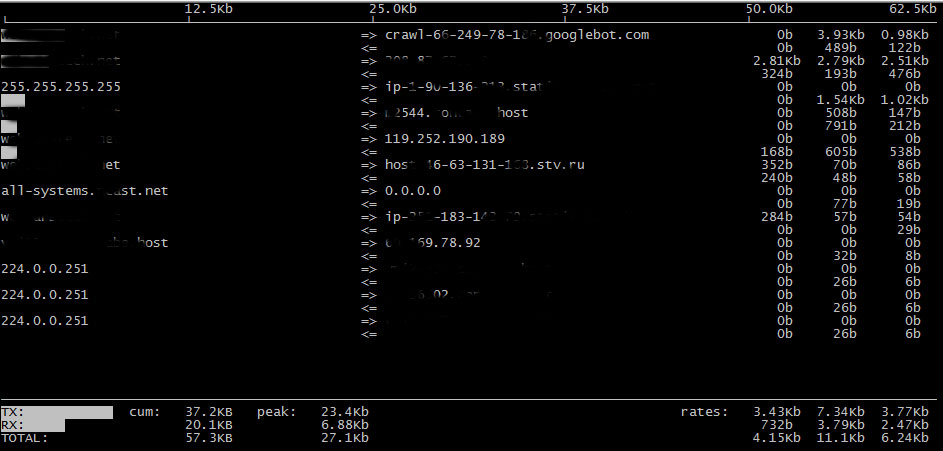
iftop – display bandwidth usage on an interface by host
display bandwidth usage on an interface by host
iftop listens to network traffic on a named interface, or on the first interface it can find which looks like an external interface if none is specified, and displays a table of current bandwidth usage by pairs of hosts.
iftop must be run with sufficient permissions to monitor all network traffic on the interface; see pcap(3) for more information, but on most systems this means that it must be run as root.
By default, iftop will look up the hostnames associated with addresses it finds in packets. This can cause substantial traffic of itself, and may result in a confusing display.
You may wish to suppress display of DNS traffic by using filter code such as not port domain, or switch it off entirely, by using the -n option or by pressing r when the program is running.
By default, iftop counts all IP packets that pass through the filter, and the direction of the packet is determined according to the direction the packet is moving across the interface.
Using the -F option it is possible to get iftop to show packets entering and leaving a given network.
For example, iftop -F 10.0.0.0/255.0.0.0 will analyse packets flowing in and out of the 10.* network.
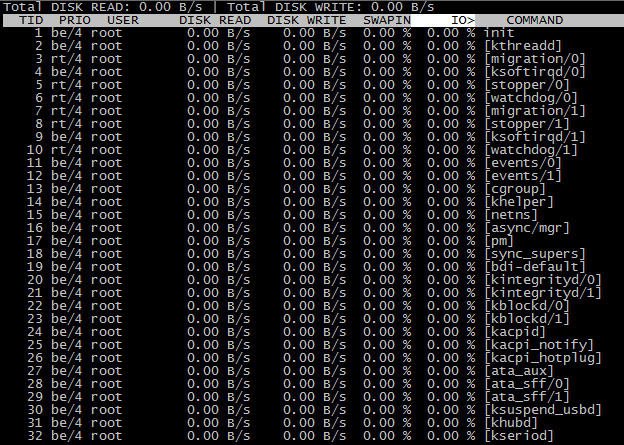
iotop – simple top-like I/O monitor
iotop watches I/O usage information output by the Linux kernel (requires 2.6.20 or later) and displays a table of current I/O usage by processes or threads on the system.
At least the CONFIG_TASK_DELAY_ACCT and CONFIG_TASK_IO_ACCOUNTING options need to be enabled in your Linux kernel build configuration, these options depend on CONFIG_TASKSTATS.
iotop requires root or the NET_ADMIN capability.
iotop displays columns for the I/O bandwidth read and written by each process/thread during the sampling period. It also displays the percentage of time the thread/process spent while swapping in and while waiting on I/O.
For each process, its I/O priority (class/level) is shown. In addition, the total I/O bandwidth read and written during the sampling period is displayed at the top of the interface.
SoX – Sound eXchange, the Swiss Army knife of audio manipulation
SoX reads and writes audio files in most popular formats and can optionally apply effects to them; it can combine multiple input sources, synthesise audio, and, on many systems, act as a general purpose audio player or a multi-track audio recorder.
It also has limited ability to split the input in to multiple output files.
Almost all SoX functionality is available using just the sox command, however, to simplify playing and recording audio, if SoX is invoked as play the output file is automatically set to be the default sound device and if invoked as rec the default sound device is used as an input source.
The heart of SoX is a library called libSoX.SoX is a command-line audio processing tool, particularly suited to making quick, simple edits and to batch processing.
If you need an interactive, graphical audio editor, use audacity.
HOW TO CONVERT GSM TO WAV AND WAV TO GSM ->
Linux Best Open Source Terminal Tools – Part2