
Network Interface Traffic Monitoring Linux

Monitoring network interface traffic on Linux is one of those tasks that looks simple until something goes wrong. Sudden bandwidth spikes, unexplained packet loss, throttling by a VPS provider, or a container silently saturating the NIC can quickly turn into an outage. When you are under pressure, you do not need theory or dashboards full of graphs — you need fast, reliable command-line tools and a clear way to interpret what you see.
This article is a practical, battle-tested guide to monitoring network interface traffic on Linux systems. It focuses on real troubleshooting scenarios on Ubuntu, Debian, VPS servers, cloud instances, and containerized environments like Docker, LXC, and Proxmox. Everything here works from the shell and can be used immediately.
What does this error mean
In the context of network interface traffic monitoring on Linux, the “error” is usually not a single error message. Instead, it shows up as symptoms:
- Network usage is higher than expected
- An interface appears idle but applications are slow
- Bandwidth limits are exceeded on a VPS
- RX/TX counters do not match real traffic
- Traffic is visible on the host but not inside a container
- Monitoring tools show zero traffic on an active interface
These symptoms indicate that traffic is flowing somewhere you are not measuring correctly, or that you are looking at the wrong interface, namespace, or abstraction layer. On modern Linux systems, especially with containers and virtual networking, this is extremely common.
The goal of traffic monitoring is not just to “see numbers”, but to correctly identify:
- Which interface is carrying traffic
- Which direction (RX or TX) is dominant
- Which process, container, or VM is responsible
- Whether traffic is real, duplicated, or offloaded
Why it happens
There are several common reasons why network interface traffic monitoring on Linux becomes confusing or misleading.
First, Linux systems often have multiple interfaces. Physical NICs, virtual bridges, VLANs, Docker bridges, veth pairs, and tunnel interfaces all coexist. Monitoring the wrong one gives meaningless data.
Second, containers and virtual machines use network namespaces. Traffic inside a container does not necessarily increment counters on the interface you expect on the host.
Third, modern NIC offloading features (GRO, GSO, TSO) can make packet-based tools report strange values. Byte counters are usually accurate, but packet rates may not be.
Fourth, some tools show instantaneous rates while others show cumulative counters. Mixing these without understanding the difference leads to wrong conclusions.
Finally, cloud and VPS environments often apply shaping, burst limits, or virtual NICs that behave differently from bare metal.
Understanding these causes is critical before jumping into fixes.
Step-by-step fix
This section walks through a reliable workflow to monitor network interface traffic on Linux, from basic counters to advanced per-process and container-level analysis.
Step 1: Identify the correct network interface
Start by listing all interfaces and their state:
ip link show
Look for:
state UP- Actual traffic counters increasing
- Interfaces like
eth0,ens3,enp0s3, or cloud-specific names
For a quick overview with traffic counters:
ip -s link
This shows RX and TX bytes and packets per interface. If counters are not increasing on the interface you expect, you are monitoring the wrong one.
On systems with bridges (Docker, Proxmox):
bridge link
This helps identify which interfaces are attached to a bridge like docker0 or vmbr0.
Step 2: Monitor live traffic rates per interface
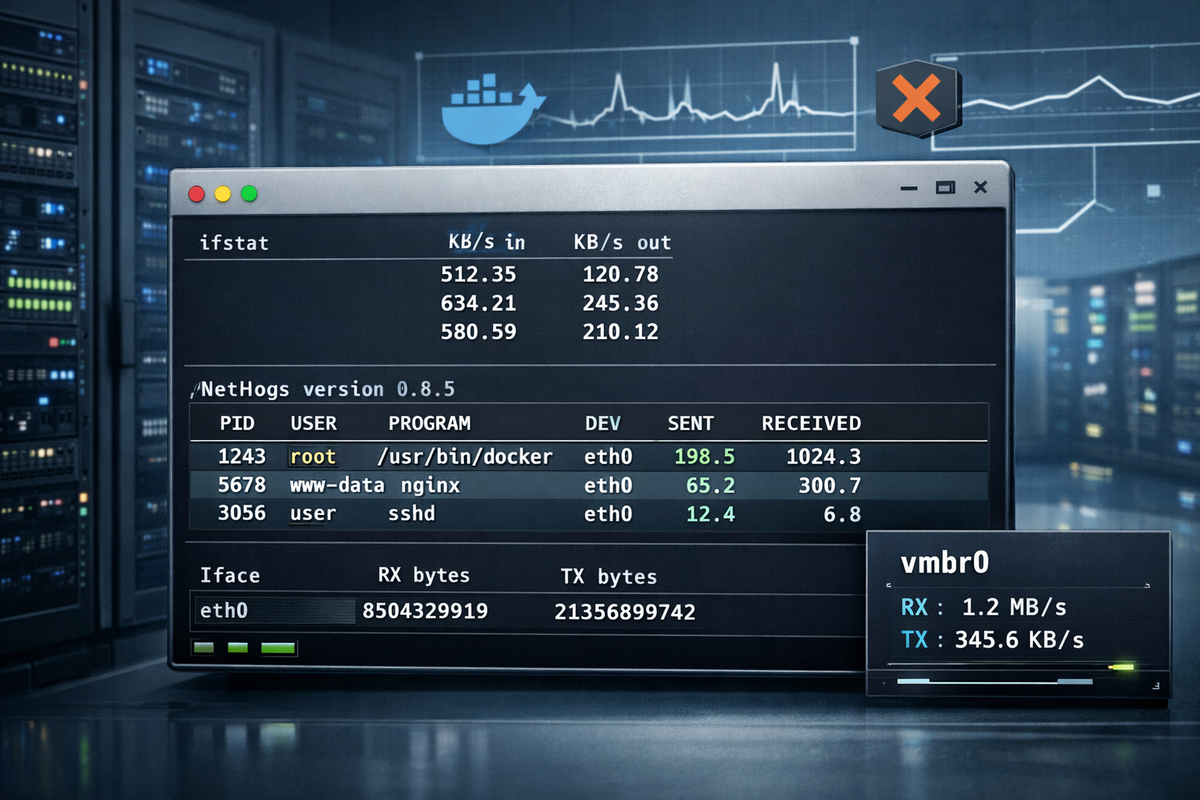
To see real-time traffic rates, use ifstat or nload.
Install if needed:
sudo apt update
sudo apt install ifstat
Run:
ifstat -i eth0 1
This shows RX/TX rates in KB/s, updated every second.
For a curses-based view:
sudo apt install nload
nload eth0
nload is especially useful during incidents because it clearly shows spikes and direction of traffic.
Step 3: Verify kernel-level counters directly
For raw counters without any formatting or averaging:
cat /proc/net/dev
This file is the source of truth for most monitoring tools. Compare values over time:
watch -n 1 cat /proc/net/dev
If counters increase here but not in your tool, the problem is the tool, not the traffic.
Step 4: Identify which process is generating traffic
When traffic is unexpectedly high, you need to map it to processes.
Use iftop for live per-connection monitoring:
sudo apt install iftop
sudo iftop -i eth0
This shows which IPs and ports are consuming bandwidth in real time.
sudo apt install nethogs
sudo nethogs eth0
nethogs maps traffic directly to PIDs and process names, which is invaluable for debugging rogue services or compromised systems.
Step 5: Monitor traffic inside Docker containers
Docker adds a common layer of confusion. Traffic often flows through docker0 and veth* interfaces.
List Docker interfaces:
ip link | grep veth
To monitor overall Docker bridge traffic:
ifstat -i docker0 1
To inspect traffic per container, enter the container’s network namespace:
docker inspect --format '{{.State.Pid}}' container_name
Then:
sudo nsenter -t PID -n ifstat -a 1
This shows traffic as seen from inside the container, which is often what you actually care about.
Step 6: Monitor traffic in LXC and Proxmox environments
In Proxmox, most traffic flows through bridges like vmbr0.
Check host-level traffic:
ifstat -i vmbr0 1
Each VM or container typically has a tap interface:
ip link | grep tap
Monitor a specific VM:
ifstat -i tap123i0 1
This isolates traffic per guest without entering it.
For LXC containers, you can also use:
pct exec <CTID> -- ifstat -a 1
Step 7: Detect dropped packets and errors
High traffic is not the only problem. Drops and errors indicate congestion or misconfiguration.
Check interface errors:
ip -s link show eth0
Look at:
- dropped
- errors
- overruns
Persistent drops under load often mean:
- NIC queue too small
- VPS bandwidth cap
- CPU bottleneck due to softirq saturation
Step 8: Log traffic for later analysis
For long-term troubleshooting, log counters periodically:
while true; do
  date
  cat /proc/net/dev | grep eth0
  sleep 60
done >> netlog.txt
This crude method is reliable, works everywhere, and avoids dependencies when you just need evidence.
Common mistakes
One of the most common mistakes is monitoring the wrong interface. On systems with bridges or containers, eth0 may show little traffic while vmbr0 or docker0 is saturated.
Another mistake is trusting packet rates instead of byte counters on systems with offloading enabled. Packet counts can be misleading.
Many administrators forget about network namespaces and assume host-level tools reflect container traffic. They often do not.
Using multiple tools at once without understanding their measurement units (bytes vs bits, cumulative vs rate) leads to incorrect conclusions.
Finally, relying on GUI dashboards during an incident instead of verifying /proc/net/dev wastes time.
FAQ
How do I monitor total bandwidth usage on a Linux VPS?
Use ip -s link or /proc/net/dev on the main interface. These counters are what providers usually bill against.
Why does my Docker container show no traffic but the host does?
Because traffic is counted on the host’s veth or bridge interface. Enter the container namespace to see its view.
Is tcpdump good for traffic monitoring?
It is good for packet inspection, not for measuring volume. Use it only when you need protocol-level detail.
Can I trust iftop and nethogs on high-speed links?
They are accurate enough for troubleshooting but may miss bursts on very high-throughput systems.
Why do RX/TX numbers differ between tools?
Different tools sample at different intervals and may include or exclude offloaded traffic.
Final checklist
- Identify the correct interface before measuring
- Verify counters in
/proc/net/dev - Use rate-based tools (
ifstat,nload) for live monitoring - Use
nethogsoriftopto identify traffic sources - Account for containers, bridges, and namespaces
- Check drops and errors, not just bandwidth
- Log raw counters when accuracy matters
If you follow this workflow, network interface traffic monitoring on Linux becomes predictable and reliable, even under pressure and in complex environments.